Search on site
Посетители
| Poultry breeding |
 |
 |
 |
Environmentally friendly sorbent for chickens, geese, ducks, quails, turkeys
|
|||||||||||||||||||||||||||||||||||||||||||||||||||||||||||||||||||||||||||||||||||||||||||||||||||||||||||||||||||||||||||||||||||||||||||||||||||||||||||||||||||||||||||||||||||||||||||||||||||||||||||||||||||||||||||||||||||||||||||||||||||||||||||||||||||||||||||||||||||||||||||||||||||||||||||||||||||||||||||||||||||||||||||||||||||||||||||||||||||||||||||||||||||||||||||||||||||||||||||||||||||||||||||||||||||||||||||||||||||||||||||||||||||||||||||||||||||||||||||||||||||||||||||||||||||||||||||||||||||||||||||||||||||||||||||||||||||||||||||||||||||||||||||||||||||||||||||||||||||||||||||||||||||||||||||||||||||||||||||||||||||||||||||||||||||||||||||||||||||||||||||||||||||||||||||||||||||||||||||||||||||||||||||||||||||||||||||||||||||||||||||||||||||||||||||||||||||||||||||||||||||||||||||||||||||||||||||||||||||||||||||||||||||||||||||||||||||||||||||||||||||||||||||||||||||||||||||||||||||||||||||||||||||||||||||||||||||||||||||||||||||||||||||||||||||||||||||||||||||||||
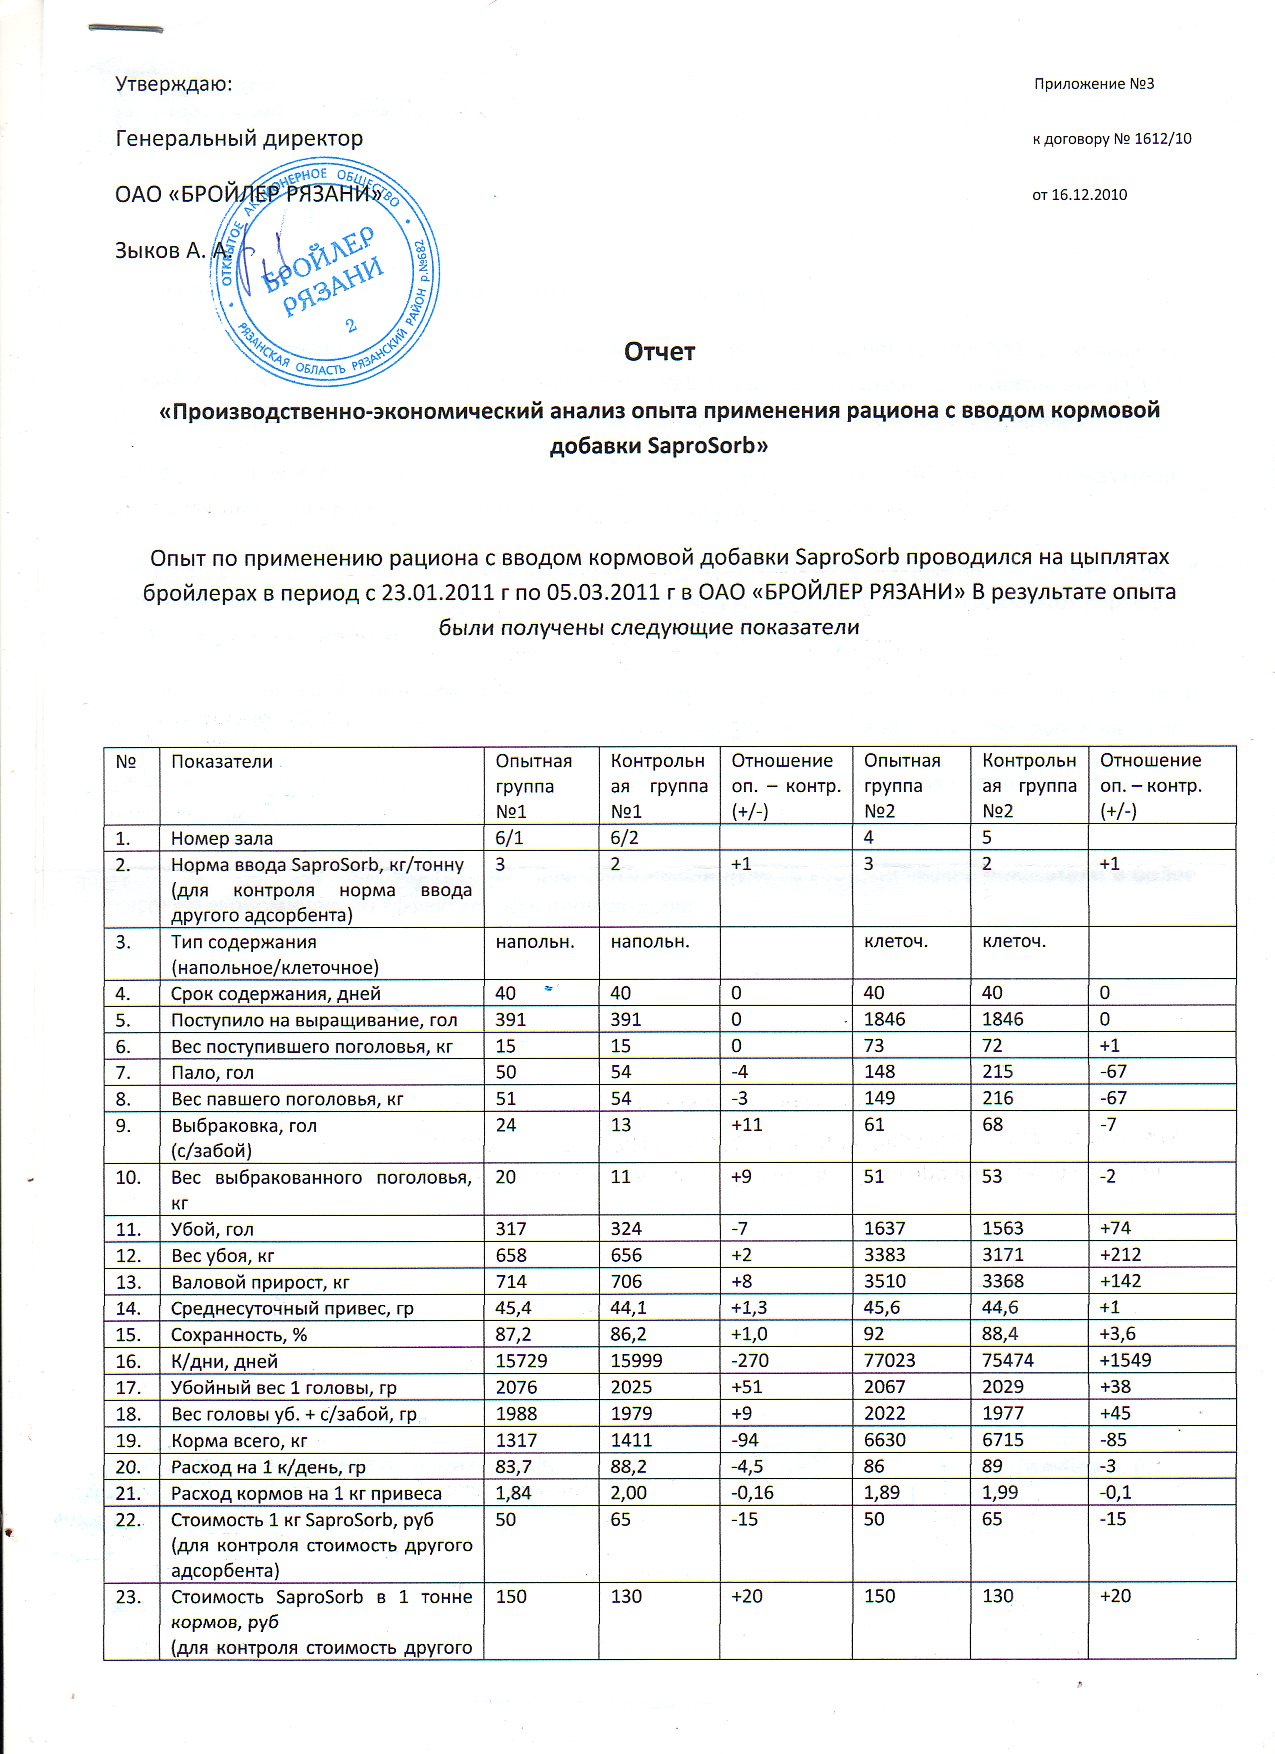
| № | data | Experimental group number 1 | The control group number 1 |
Experimental attitude - control (+ / -) |
Experimental group number 2 | The control group number 2 | Experimental attitude - control (+ / -) |
| 1 | Number hall | 6/1 | 6/2 | 4 | 5 | ||
| 2 | Norm input SaproSorb, kg / ton (to control the rate of entry of another adsorbent) | 3 | 2 | +1 | 3 | 2 | +1 |
| 3 | Content type (floor / cell) | floor | floor | cell | cell | ||
| 4 | The period of time, days | 40 | 40 | 0 | 40 | 40 | 0 |
| 5 | Received on growing, heads | 391 | 391 | 0 | 1846 | 1846 | 0 |
| 6 | Weight incoming livestock, kg | 15 | 15 | 0 | 73 | 72 | +1 |
| 7 | Deaths, heads | 50 | 54 | -4 | 148 | 215 | -67 |
| 8 | Weight fallen stock, kg | 51 | 54 | -3 | 149 | 216 | -67 |
| 9 | Culling, heads (slaughter) | 24 | 13 | +11 | 61 | 68 | -7 |
| 10 | Weight culled livestock kg | 20 | 11 | +9 | 51 | 53 | -2 |
| 11 | Slaughter, kg | 317 | 324 | -7 | 1637 | 1563 | +74 |
| 12 | Slaughter weight, kg | 658 | 656 | +2 | 3383 | 3171 | +212 |
| 13 | Gross gain, kg | 714 | 706 | +8 | 3510 | 3368 | +142 |
| 14 | Average daily gain, c | 45,4 | 44,1 | +1,3 | 45,6 | 44,6 | +1 |
| 15 | Storability % | 87,2 | 86,2 | +1,0 | 92 | 88,4 | +3,6 |
| 16 | Feeding / day, days | 15729 | 15999 | -270 | 77023 | 75474 | +1549 |
| 17 | Carcass weight 1 head g | 2076 | 2025 | +51 | 2067 | 2029 | +38 |
| 18 | Weight of the head case + backspace, g | 1988 | 1979 | +9 | 2022 | 1977 | +45 |
| 19 | Just feed, kg | 1317 | 1411 | -94 | 6630 | 6715 | -85 |
| 20 | Consumption per 1k / day c | 83,7 | 88,2 | -4,5 | 86 | 89 | -3 |
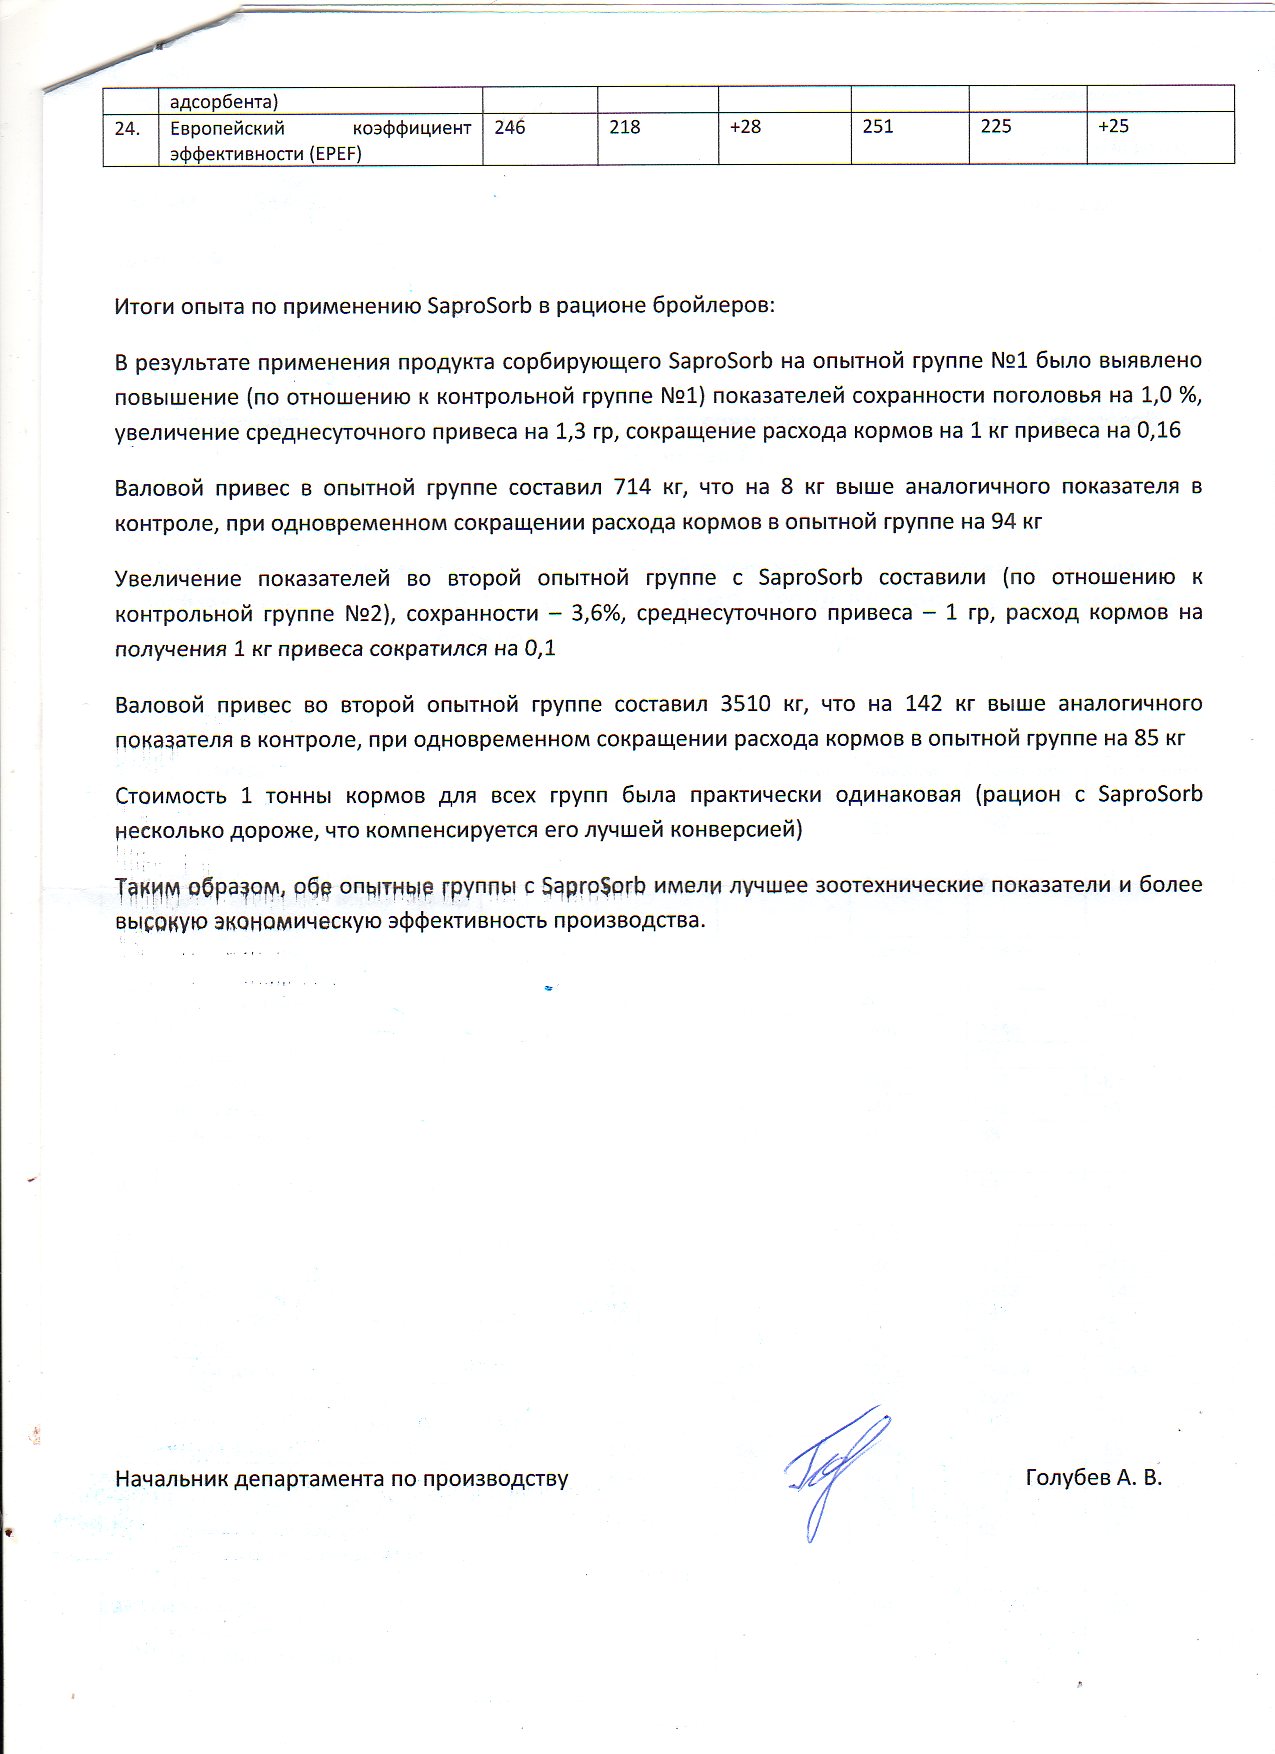
| 21 | Feed consumption per 1 kg of body weight gain | 1,84 | 2,00 | -0,16 | 1,89 | 1,99 | -0,1 |
| 22 | The cost of 1kg SaproSorb, rub (to control the cost of adsorbent) | 50 | 65 | -15 | 50 | 65 | -15 |
| 23 | Cost SaproSorb 1 ton of feed, rub (to control the cost of other adsorbent) | 150 | 130 | +20 | 150 | 130 | +20 |
| 24 | European efficiency factor (EPEF) | 246 | 218 | +28 | 251 | 225 | +25 |
Results of experience in the use of the diet of broilers SaproSorb:
As a result, use of the product on the sorbent SaproSorb experimental group number 1, it was revealed elevation (relative to the control group number 1) safety indicators livestock 1.0% increase in average daily gain of 1.3 g, the reduction of feed consumption per 1 kg gain 0.16
Gross gain in the experimental group was 714kg, which is higher than 8kg in control, while reducing feed consumption in the experimental group at 94kg
Increase in performance in the second experimental group with SaproSorb reached (relative to the control group number 2) preservation - 3.6%, average daily gain - 1g, feed consumption for producing 1 kg of weight gain was reduced by 0.1
Gross gain in the second experimental group was 3510kg, which is 142kg higher than in the control, while reducing feed consumption in the experimental group at 85 kg
Cost of 1 ton of feed for all groups was almost the same (diet with SaproSorb more expensive, which is compensated by its better conversion)
Thus, both experimental groups with SaproSorb had better zootechnical performance and higher production efficiency.
СJSC "Mosselprom"
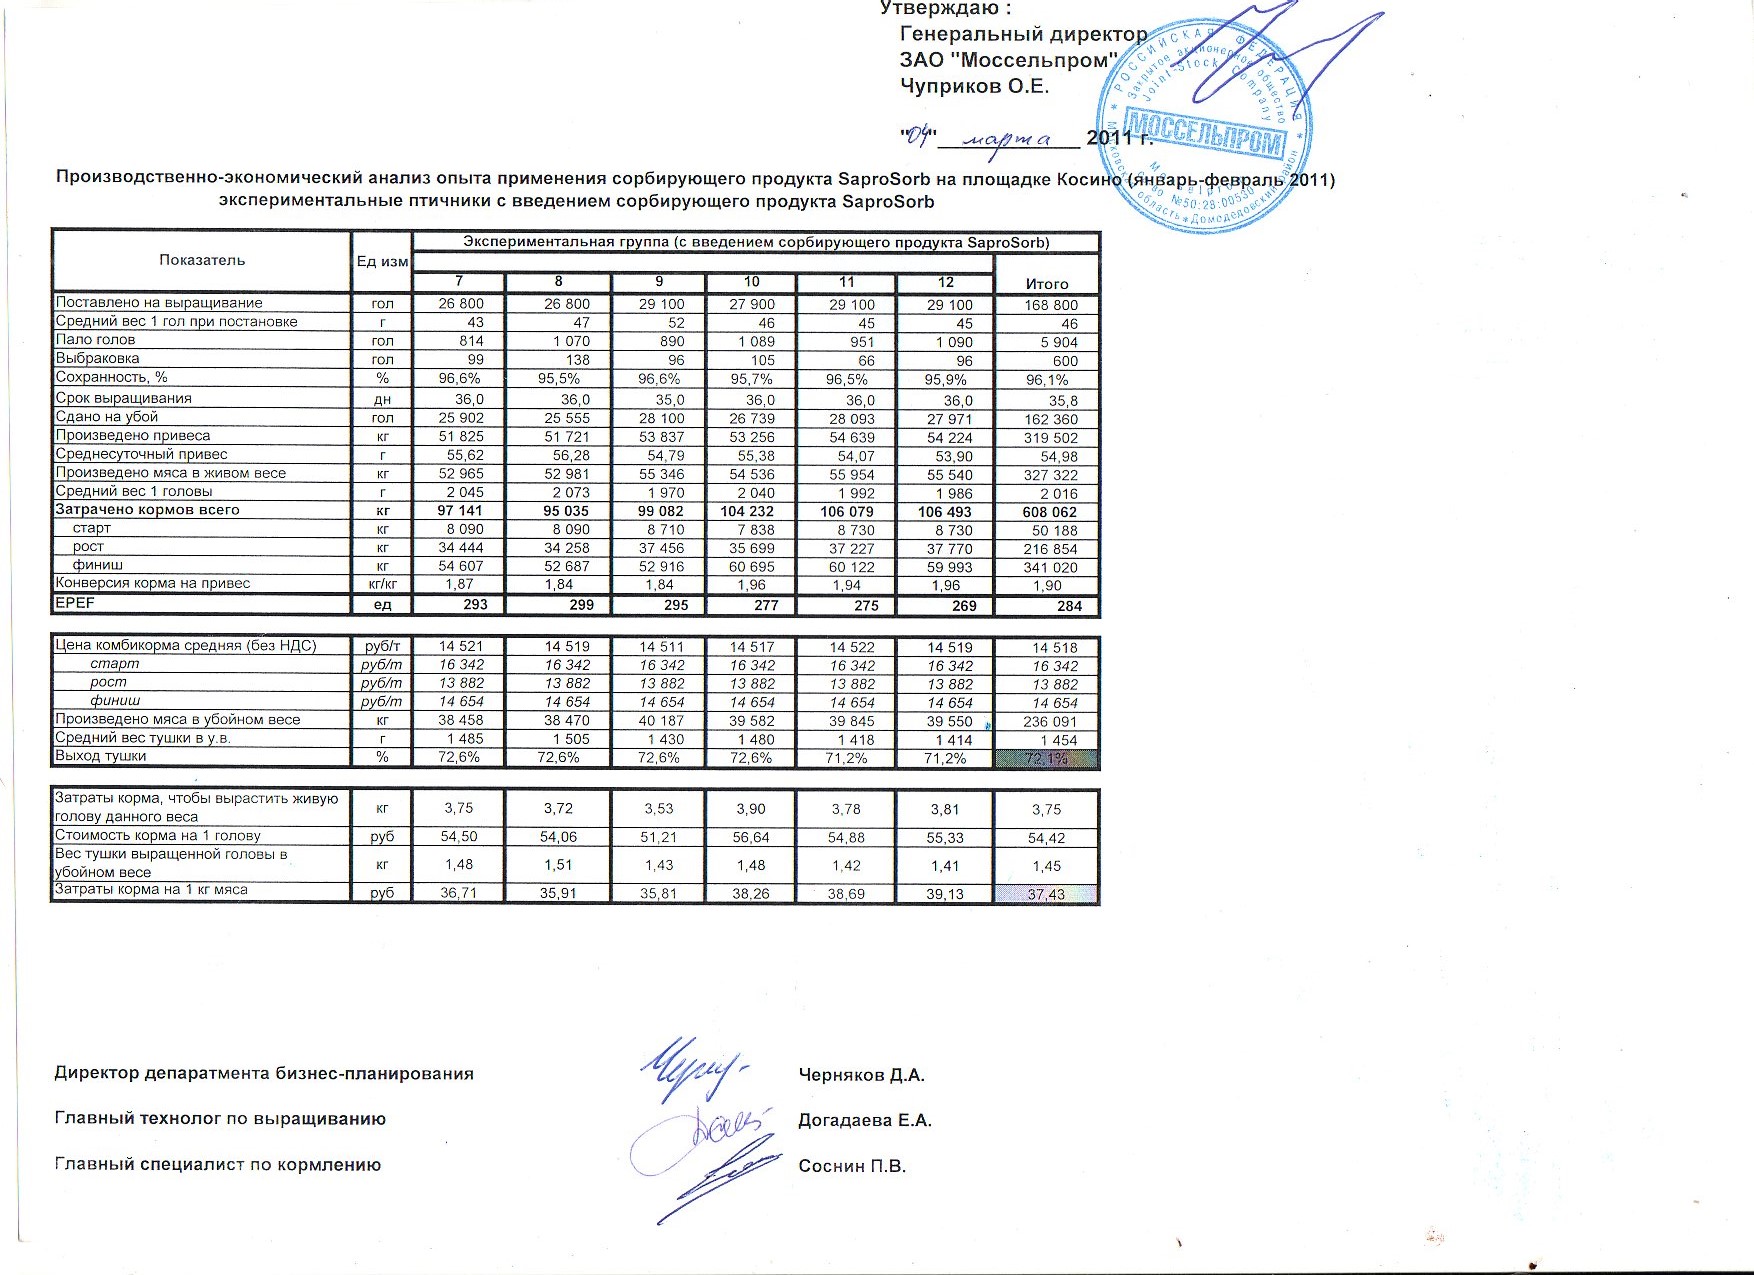
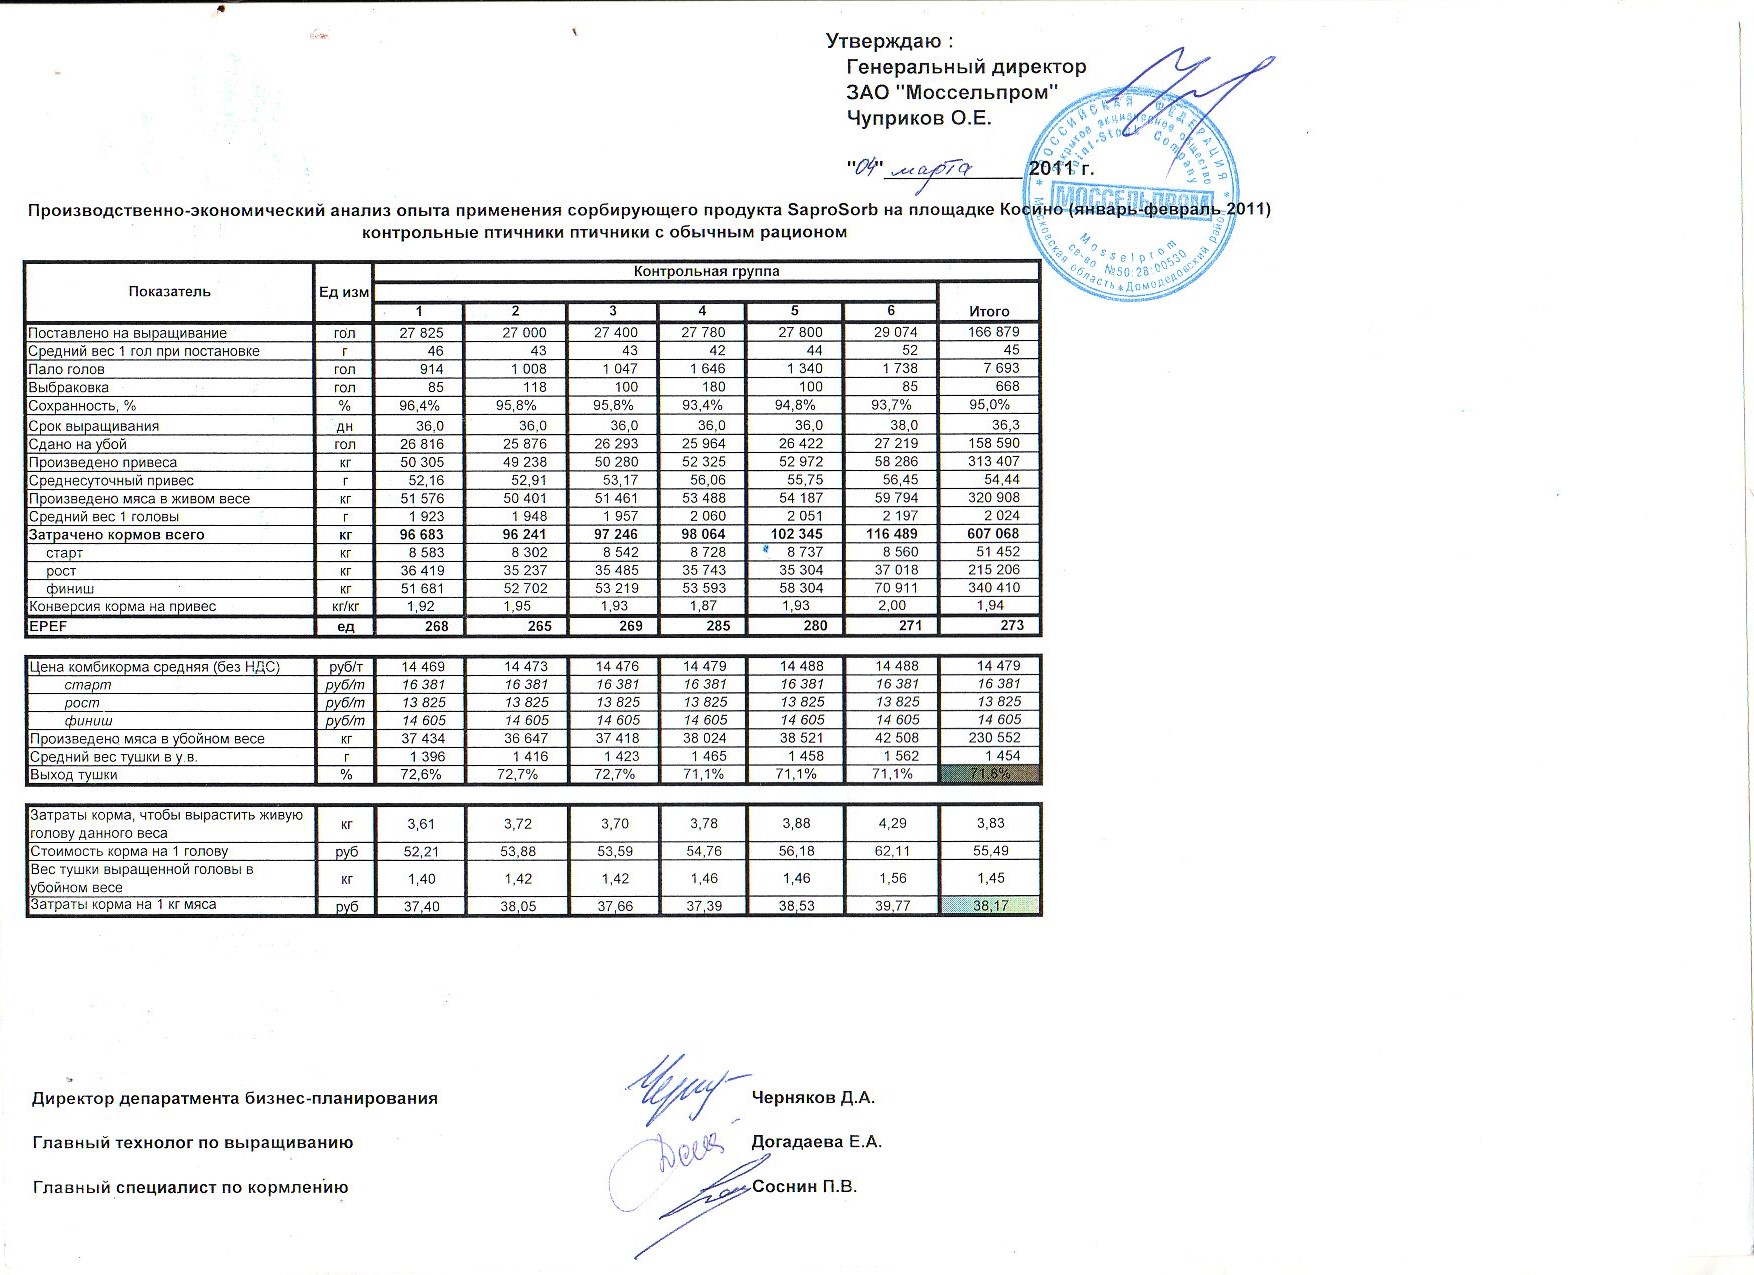
Experiment to test production - cost-effectiveness of the product absorbing «SaproSORB» held in poultry broilers СJSC "Mosselprom" in the period from 11.01.2011 to 04.03.2011
As a result of the experiment, it was found that the experimental group, which was given «SaproSORB» in diet composition at 4 kg per 1 ton of finished feed, showed a higher rate (EPEF) and more cost-effective in calculating the cost of production of 1 kg of meat.
experiment
Production and economic analysis of the experience of the sorbent product SaproSORB broilers
area Koshino (January-February 2011)
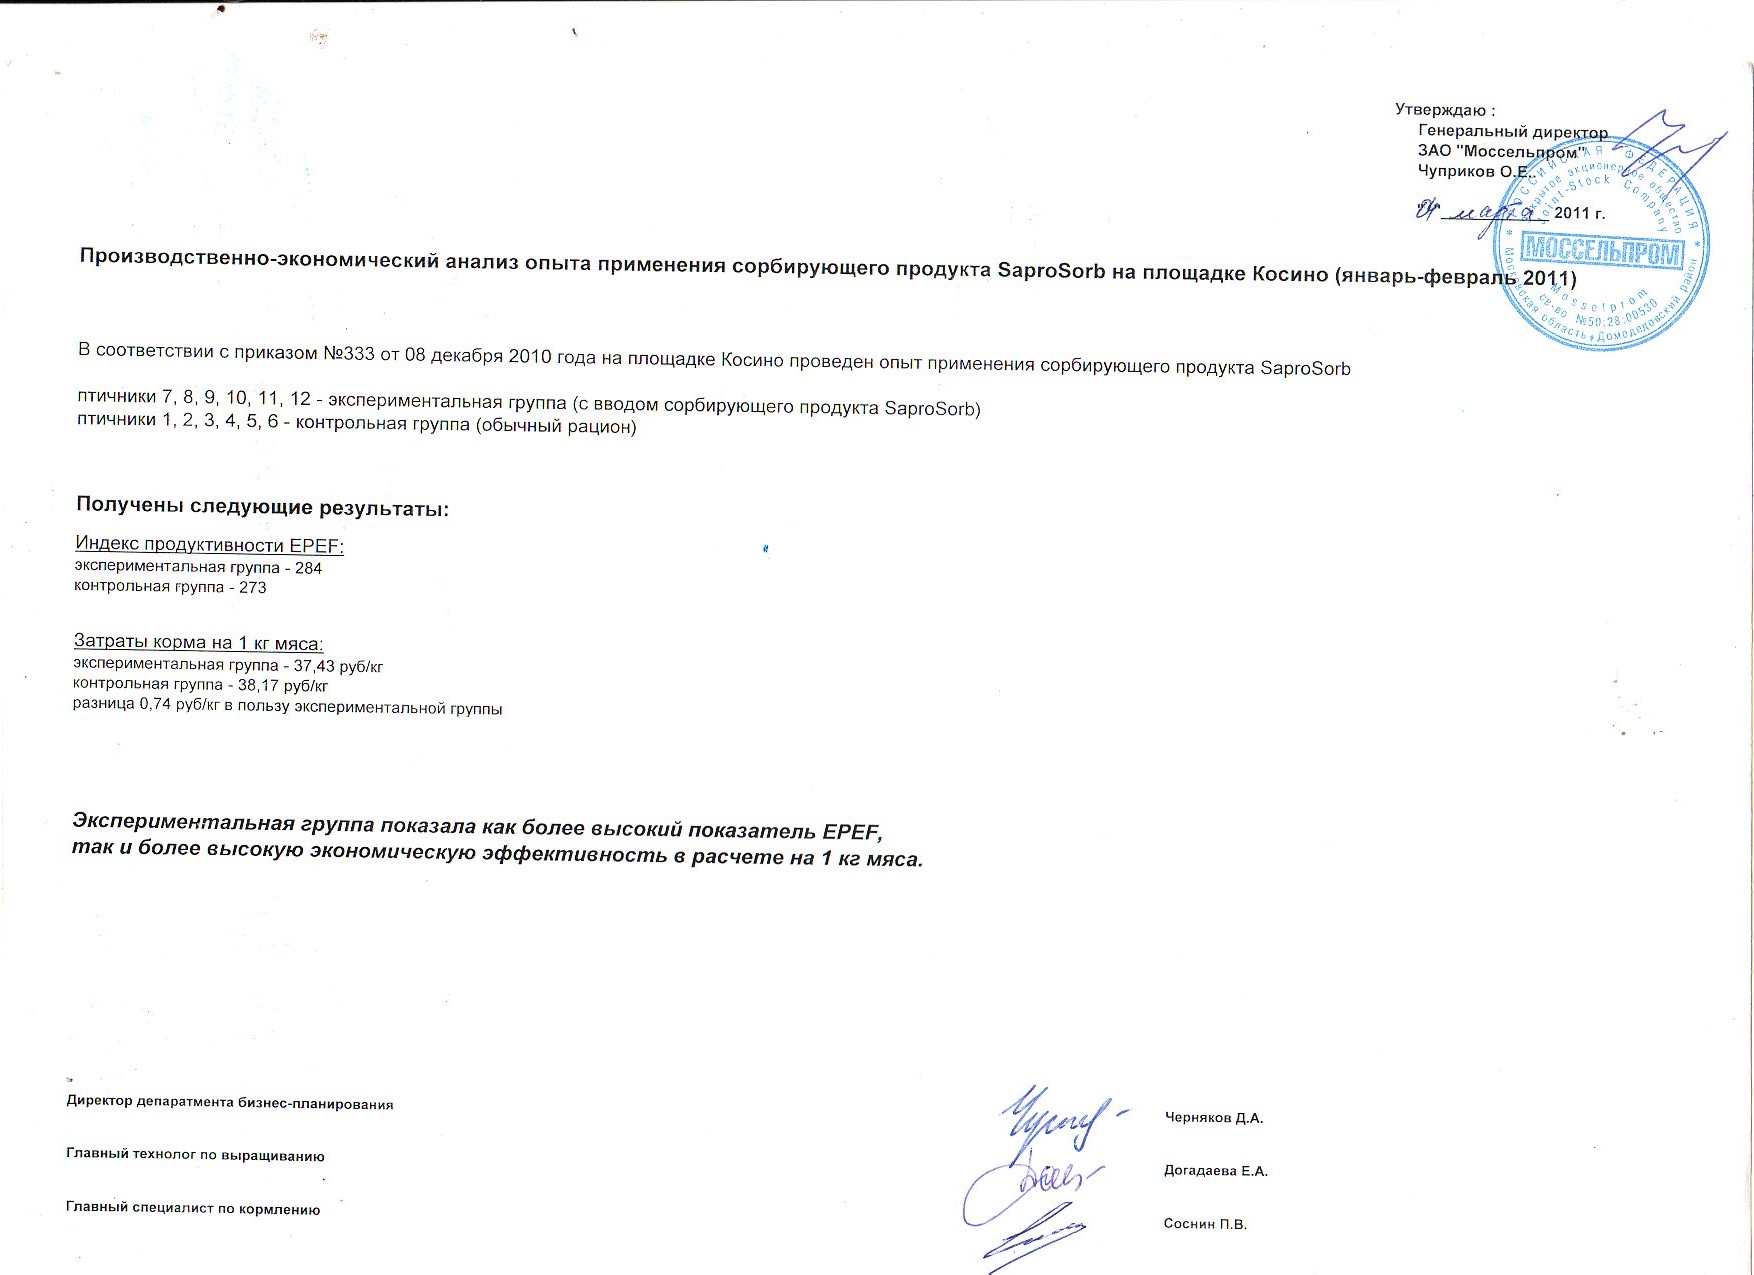
In accordance with the order number 333 of December 08, 2010 on the site Koshino held experience of sorbent product SaproSorb
poultry 7, 8, 9, 10, 11, 12 - an experimental group (with the introduction of absorbing product SaproSorb)
poultry 1, 2, 3, 4, 5, 6 - control group (normal diet)
The following results:
Productivity index EPEF:
experimental group - 284
control group - 273
The cost of feed per 1 kg of meat:
experimental group - 37.43 rub / kg
control group - 38.17 rub / kg
difference 0.74 rub / kg in favor of the experimental group
The experimental group showed a higher rate as EPEF, and higher economic efficiency per 1kg of meat.
Production - economic analysis experience with sorbent product SaproSORB on site Koshino (January-February 2011) with the introduction of the experimental poultry sorbent product SaproSORB
| index | units of measurement | The experimental group (with the introduction of absorbing product SaproSORB) | in total | |||||
| 7 | 8 | 9 | 10 | 11 | 12 | |||
| Delivered on growing | Head | 26 800 | 26 800 | 29 100 | 27 900 | 29 100 | 29 100 | 168800 |
| The average weight of one head in the formulation | G | 43 | 47 | 52 | 46 | 45 | 45 | 46 |
| deaths heads | Head | 814 | 1 070 | 890 | 1 089 | 951 | 1 090 | 5 904 |
| culling | Head | 99 | 138 | 96 | 105 | 66 | 96 | 600 |
| Storability % | % | 96.6% | 95.5% | 96.6% | 95.7% | 96.5% | 95.9% | 96.1% |
| term cultivation | Days | 36.0 | 36.0 | 35.0 | 36,0 | 36,0 | 36,0 | 35,8 |
| Rented for slaughter | Head | 25 902 | 25 555 | 28 100 | 26 739 | 28 093 | 27,971 | 162360 |
| produced gain | Kg | 51 825 | 51 721 | 53 837 | 53 256 | 54 639 | 54 224 | 319502 |
| average daily gain | G | 55,62 | 56,28 | 54,79 | 55,38 | 54,07 | 53,90 | 54,98 |
| Produced meat in live weight | Kg | 52 965 | 52 981 | 55 346 | 54 536 | 55 954 | 55 540 | 327322 |
| The average weight of one head | G | 2 045 | 2 073 | 1 970 | 2 040 | 1 992 | 1 986 | 2 016 |
| Expended all feeds | Kg | 97 141 | 95 035 | 99 082 | 104 082 | 106 079 | 106 493 | 608062 |
| start | Kg | 8 090 | 8 090 | 8 710 | 7 838 | 8 730 | 8 730 | 50 188 |
| growth | Kg | 34 444 | 34 258 | 37 456 | 35 699 | 37 227 | 37 770 | 216854 |
| finish | Kg | 54 607 | 52 687 | 52 916 | 60 695 | 60 122 | 59 993 | 341020 |
| Feed conversion to gain | Kg/Kg | 1,87 | 1,84 | 1,84 | 1,96 | 1,94 | 1,96 | 1,90 |
| EPEF | unit | 293 | 299 | 295 | 277 | 275 | 269 | 284 |
| Price feed today (excluding VAT) | Rub/t | 14 521 | 14 519 | 14 511 | 14 517 | 14 522 | 14 519 | 14 518 |
| start | Rub/m | 16 342 | 16 342 | 16 342 | 16 342 | 16 342 | 16 342 | 16 342 |
| growth | Rub/m | 13 882 | 13 882 | 13 882 | 13 882 | 13 882 | 13 882 | 13 882 |
| finish | Rub/m | 14 654 | 14 654 | 14 654 | 14 654 | 14 654 | 14 654 | 14 654 |
| Produced meat in carcass weight | Kg | 38 458 | 38 470 | 40 187 | 39 582 | 39 845 | 39 550 | 236091 |
| Average carcass weight in u.v | G | 1 485 | 1 505 | 1 430 | 1 480 | 1 418 | 1 414 | 1 454 |
| carcass yield | % | 72,6% | 72,6% | 72,6% | 72,6% | 71,2% | 71,2% | |
| The cost of feed that would raise living head of a given weight | Kg | 3,75 | 3,72 | 3,53 | 3,90 | 3,78 | 3,81 | 3,75 |
| Feed cost per 1 head | Rub | 54,50 | 54,06 | 51,21 | 56,64 | 54,88 | 55,33 | 54,42 |
| Carcass weight reared their heads in the form of slaughter | Kg | 1,48 | 1,51 | 1,43 | 1,48 | 1,42 | 1,41 | 1,45 |
| The cost of feed per 1 kg of meat | Rub | 36,71 | 35,91 | 35,81 | 38,26 | 38,69 | 39,13 | 37,43 |
Production - economic analysis experience with sorbent product SaproSORB on site Koshino (January-February 2011) to control poultry usual diet
| index | units of measurement | Control group | in total | |||||
| 1 | 2 | 3 | 4 | 5 | 6 | |||
| Delivered on growing | Head | 27 825 | 27 000 | 27 400 | 27 780 | 27 800 | 29 074 | 166 879 |
| The average weight of one head in the formulation | G | 46 | 43 | 43 | 42 | 44 | 52 | 45 |
| deaths heads | Head | 914 | 1 008 | 1 047 | 1 646 | 1 340 | 1 738 | 7 693 |
| culling | Head | 85 | 118 | 100 | 180 | 100 | 85 | 668 |
| Storability % | % | 96,4% | 95,8% | 95,8% | 93,4% | 94,8% | 93,7% | 95,0% |
| term cultivation | Days | 36,0 | 36,0 | 36,0 | 36,0 | 36,0 | 38,0 | 36,3 |
| Rented for slaughter | Head | 26 816 | 25 876 | 26 293 | 25 964 | 26 422 | 27 219 | 158 590 |
| produced gain | Kg | 50 305 | 49 238 | 50 280 | 52 325 | 52 972 | 58 286 | 313 407 |
| average daily gain | G | 52,16 | 52,91 | 53,17 | 56,06 | 55,75 | 56,45 | 54,44 |
| Produced meat in live weight | Kg | 51 576 | 50 401 | 51 461 | 53 488 | 54 187 | 59 794 | 320 908 |
| The average weight of one head | G | 1 923 | 1 948 | 1 957 | 2 060 | 2 051 | 2 197 | 2 024 |
| Expended all feeds | Kg | 96683 | 96241 | 97246 | 98064 | 102345 | 116489 | 607068 |
| start | Kg | 8 583 | 8 302 | 8 542 | 8 728 | 8 737 | 8 560 | 51 452 |
| growth | Kg | 36 419 | 35 237 | 35 485 | 35 743 | 35 304 | 37 018 | 215 206 |
| finish | Kg | 51 681 | 52 702 | 53 219 | 53 593 | 58 304 | 70 911 | 340 410 |
| Feed conversion to gain | Kg/Kg | 1,92 | 1,95 | 1,93 | 1,87 | 1,93 | 2,00 | 1,94 |
| EPEF | unit | 268 | 265 | 269 | 285 | 280 | 271 | 273 |
| Price feed today (excluding VAT) | Rub/t | 14 469 | 14 473 | 14 476 | 14 479 | 14 488 | 14 488 | 14 479 |
| start | Rub/m | 16 381 | 16 381 | 16 381 | 16 381 | 16 381 | 16 381 | 16 381 |
| growth | Rub/m | 13 825 | 13 825 | 13 825 | 13 825 | 13 825 | 13 825 | 13 825 |
| finish | Rub/m | 14 605 | 14 605 | 14 605 | 14 605 | 14 605 | 14 605 | 14 605 |
| Produced meat in carcass weight | Kg | 37 434 | 36 647 | 37 418 | 38 024 | 38 521 | 42 508 | 230 552 |
| Average carcass weight in u.v | G | 1 396 | 1 416 | 1 423 | 1 465 | 1 458 | 1 562 | 1 454 |
| carcass yield | % | 72,6% | 72,7% | 72,7% | 71,1% | 71,1% | 71,1% | |
| The cost of feed that would raise living head of a given weight | Kg | 3,61 | 3,72 | 3,70 | 3,78 | 3,88 | 4,29 | 3,83 |
| Feed cost per 1 head | Rub | 52,21 | 53,88 | 53,59 | 54,76 | 56,18 | 62,11 | 55,49 |
| Carcass weight reared their heads in the form of slaughter | Kg | 1,40 | 1,42 | 1,42 | 1,46 | 1,46 | 1,56 | 1,45 |
| The cost of feed per 1 kg of meat | Rub | 37,40 | 38,05 | 37,66 | 37,39 | 38,53 | 39,77 |
38,17 |
JSC "Poultry Factory Yuryevets"
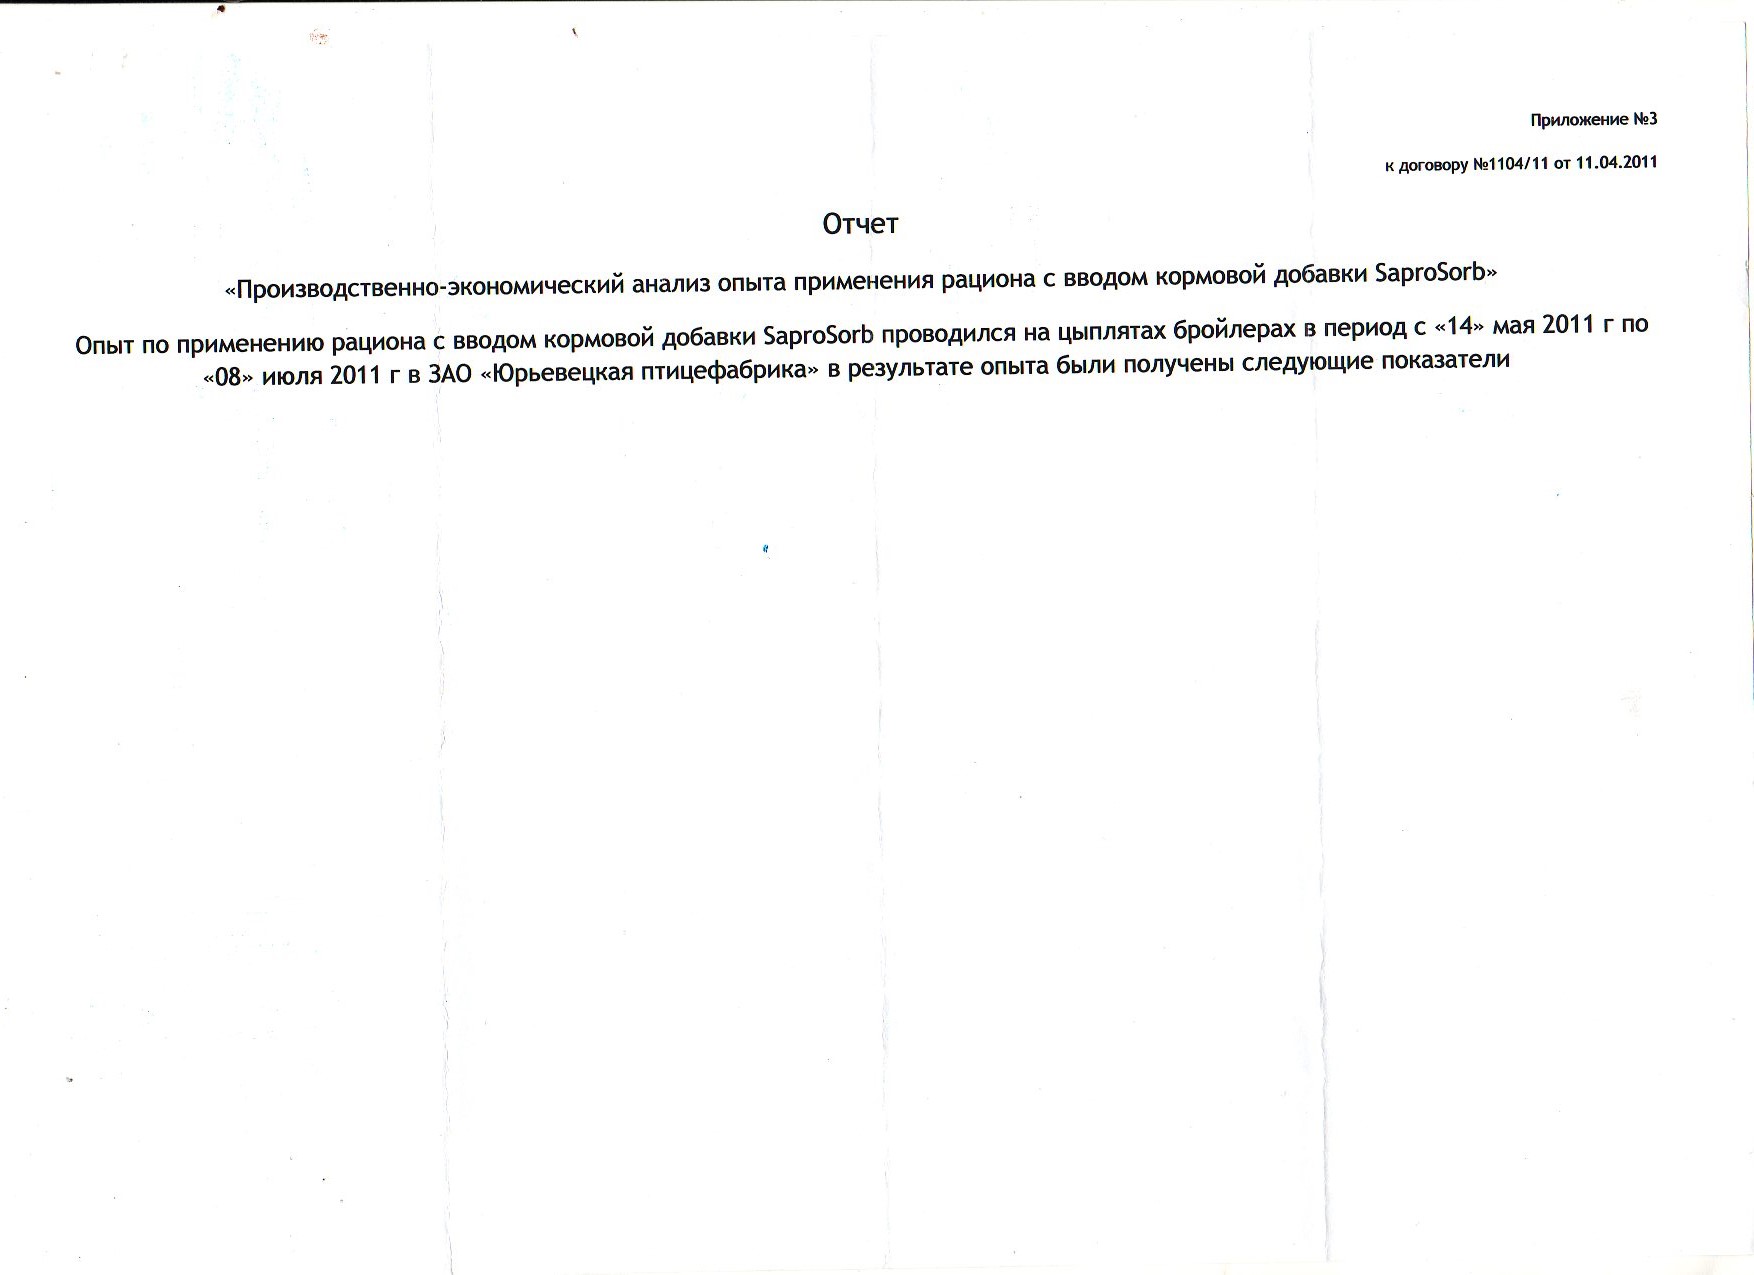
Experiment to verify the production and economic efficiency of the feed additive in feeding broilers SaproSORB held in CJSC "Yuryevets Poultry Factory" in the period from 14.05.11 to 08.06.11
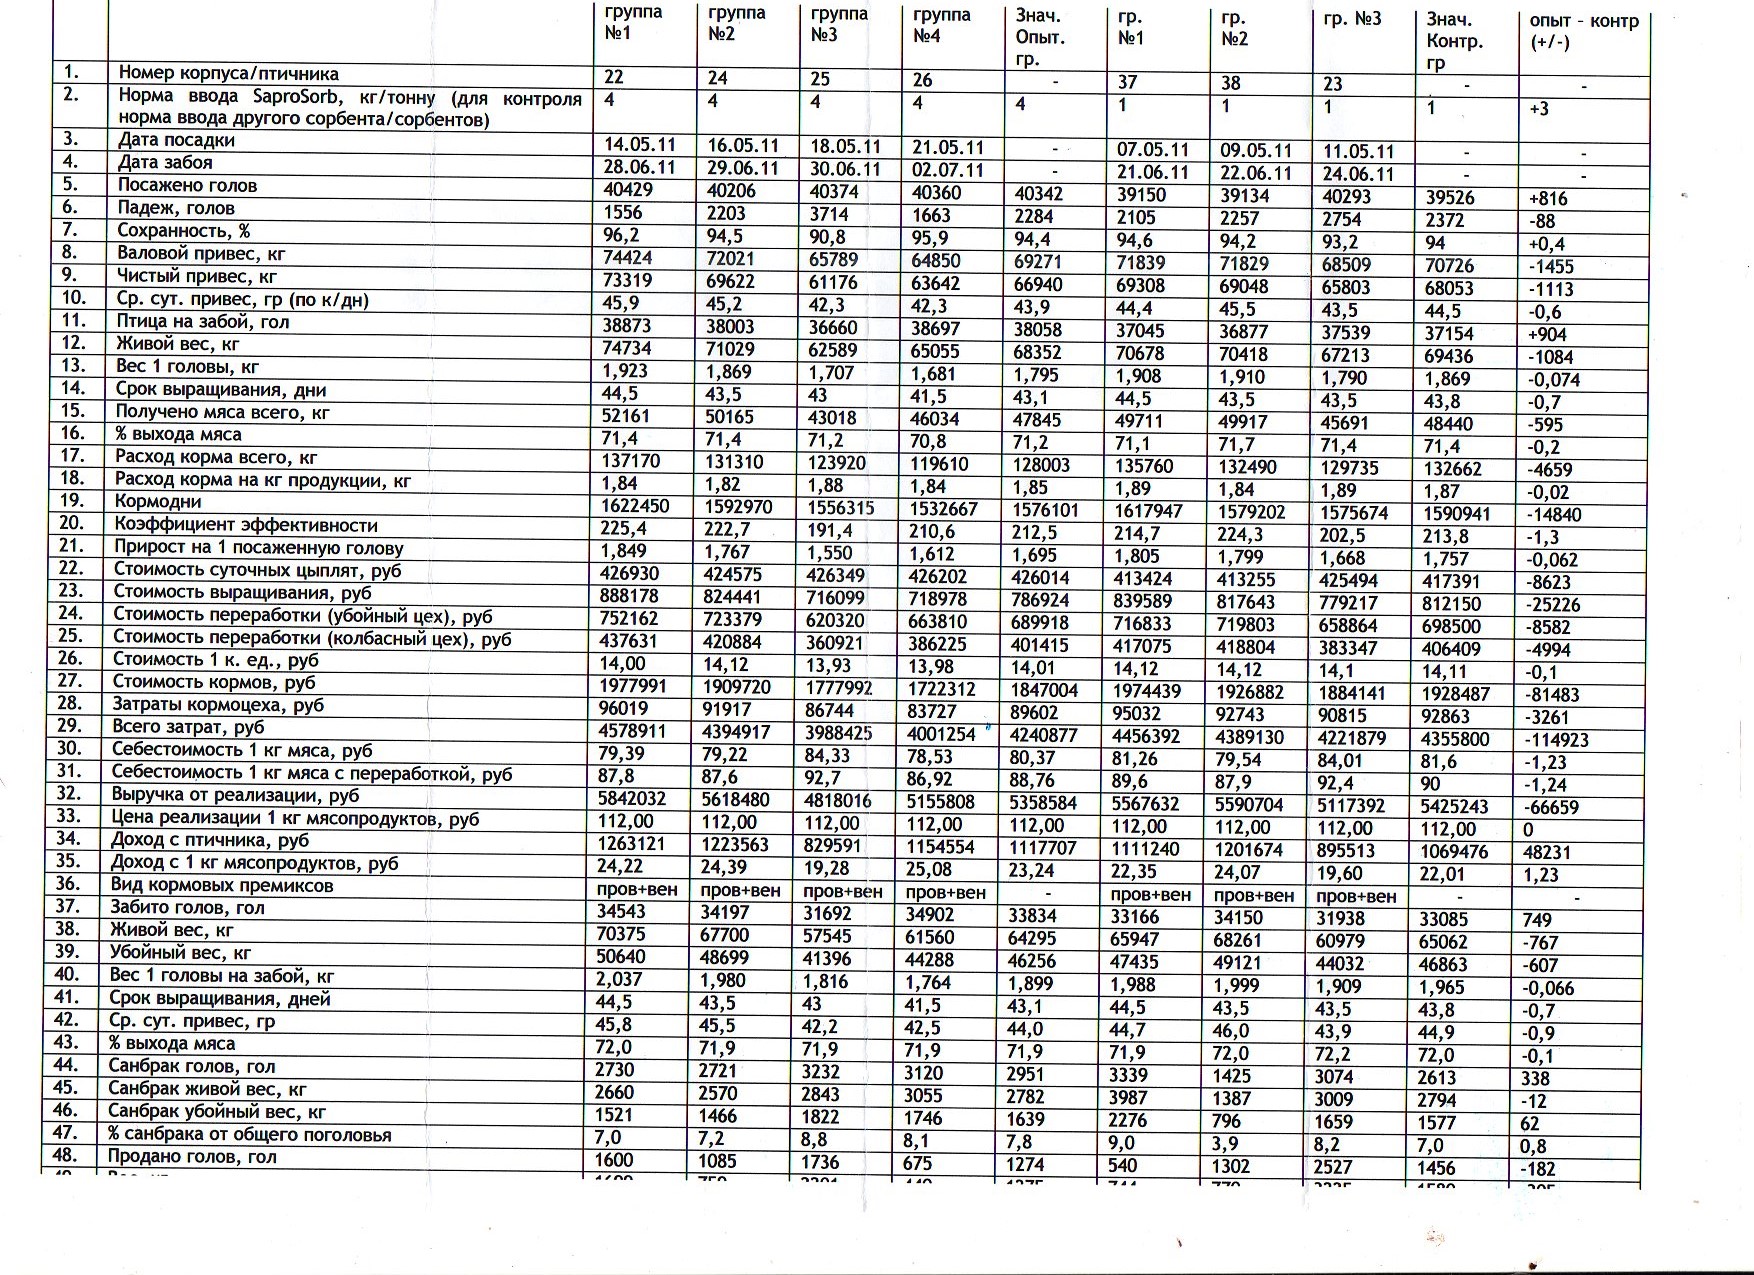
During the experiment, it was established that that application SaproSORB in the diet of broilers experimental groups compared with control groups, will reduce the cost of meat and produce units, as a consequence, increase the income of the company from the products sold.
Report
"Production and economic analysis experience with the diet with the introduction of a feed additive SaproSorb»
|
№ |
data |
Experimental group number 1 |
Experimental group number 2 |
Experimental group number 3 |
Experimental group number 4 |
Experience. c. |
number 1 |
number 2 |
number 3 |
Experience. c. |
Average value experienced - control (+ / -) |
|
1. |
Number Case / poultry house |
22 |
24 |
25 |
26 |
- |
37 |
38 |
23 |
- |
- |
|
2. |
Norm input SaproSorb, kg / ton (to control the rate of entry of another sorbent / sorbents) |
4 |
4 |
4 |
4 |
4 |
1 |
1 |
1 |
1 |
+3 |
|
3. |
Date of planting |
14.05.11 |
16.05.11 |
18.05.11 |
21.05.11 |
- |
07.05.11 |
09.05.11 |
11.05.11 |
- |
- |
|
4. |
Date of slaughter |
28.06.11 |
29.06.11 |
30.06.11 |
02.07.11 |
- |
21.06.11 |
22.06.11 |
24.06.11 |
- |
- |
|
5. |
planted heads |
40429 |
40206 |
40374 |
40360 |
40342 |
39150 |
39134 |
40293 |
39526 |
+816 |
|
6. |
Deaths, heads |
1556 |
2203 |
3714 |
1663 |
2284 |
2105 |
2257 |
2754 |
2372 |
-88 |
|
7. |
Storability,% |
96,2 |
94,5 |
90,8 |
95,9 |
94,4 |
94,6 |
94,2 |
93,2 |
94 |
+0,4 |
|
8. |
Gross gain, kg |
74424 |
72021 |
65789 |
64850 |
69271 |
71839 |
71829 |
68509 |
70726 |
-1455 |
|
9. |
Net weight gain, kg |
73319 |
69622 |
61176 |
63642 |
66940 |
69308 |
69048 |
65803 |
68053 |
-1113 |
|
10. |
Cf. d. gain, g (according to / day) |
45,9 |
45,2 |
42,3 |
42,3 |
43,9 |
44,4 |
45,5 |
43,5 |
44,5 |
-0,6 |
|
11. |
Bird on the face, heads |
38873 |
38003 |
36660 |
38697 |
38058 |
37045 |
36877 |
37539 |
37154 |
+904 |
|
12. |
Live weight, kg |
74734 |
71029 |
62589 |
65055 |
68352 |
70678 |
70418 |
67213 |
69436 |
-1084 |
|
13. |
1 head weight, kg |
1,923 |
1,869 |
1,707 |
1,681 |
1,795 |
1,908 |
1,910 |
1,790 |
1,869 |
-0,074 |
|
14. |
Term cultivation, days |
44,5 |
43,5 |
43 |
41,5 |
43,1 |
44,5 |
43,5 |
43,5 |
43,8 |
-0,7 |
|
15. |
Obtained all meat, kg |
52161 |
50165 |
43018 |
46034 |
47845 |
49711 |
49917 |
45691 |
48440 |
-595 |
|
16. |
% Meat yield |
71,4 |
71,4 |
71,2 |
70,8 |
71,2 |
71,1 |
71,7 |
71,4 |
71,4 |
-0,2 |
|
17. |
Total feed consumption, kg |
137170 |
131310 |
123920 |
119610 |
128003 |
135760 |
132490 |
129735 |
132662 |
-4659 |
|
18. |
Feed consumption per kg of product, kg |
1,84 |
1,82 |
1,88 |
1,84 |
1,85 |
1,89 |
1,84 |
1,89 |
1,87 |
-0,02 |
|
19. |
forage days |
1622450 |
1592970 |
1556315 |
1532667 |
1576101 |
1617947 |
1579202 |
1575674 |
1590941 |
-14840 |
|
20. |
efficiency ratio |
225,4 |
222,7 |
191,4 |
210,6 |
212,5 |
214,7 |
224,3 |
202,5 |
213,8 |
-1,3 |
|
21. |
An increase of 1 planted head |
1,849 |
1,767 |
1,550 |
1,612 |
1,695 |
1,805 |
1,799 |
1,668 |
1,757 |
-0,062 |
|
22. |
The cost of day-old chicks, rub |
426930 |
424575 |
426349 |
426202 |
426014 |
413424 |
413255 |
425494 |
417391 |
-8623 |
|
23. |
Cost of cultivation, rub |
888178 |
824441 |
716099 |
718978 |
786924 |
839589 |
817643 |
779217 |
812150 |
-25226 |
|
24. |
Processing cost (slaughterhouse) rub |
752162 |
723379 |
620320 |
663810 |
689918 |
716833 |
719803 |
658864 |
698500 |
-8582 |
|
25. |
Cost of processing (sausage shop) rub |
437631 |
420884 |
360921 |
386225 |
401415 |
417075 |
418804 |
383347 |
406409 |
-4994 |
|
26. |
Cost of 1 room units, rub. |
14,00 |
14,12 |
13,93 |
13,98 |
14,01 |
14,12 |
14,12 |
14,1 |
14,11 |
-0,1 |
|
27. |
The cost of feed, rub |
1977991 |
1909720 |
1777992 |
1722312 |
1847004 |
1974439 |
1926882 |
1884141 |
1928487 |
-81483 |
|
28. |
Costs feed department, rub |
96019 |
91917 |
86744 |
83727 |
89602 |
95032 |
92743 |
90815 |
92863 |
-3261 |
|
29. |
Total costs rub |
4578911 |
4394917 |
3988425 |
4001254 |
4240877 |
4456392 |
4389130 |
4221879 |
4355800 |
-114923 |
|
30. |
Cost of 1 kg of meat, rub |
79,39 |
79,22 |
84,33 |
78,53 |
80,37 |
81,26 |
79,54 |
84,01 |
81,6 |
-1,23 |
|
31. |
Cost of 1 kg of meat processing, rub |
87,8 |
87,6 |
92,7 |
86,92 |
88,76 |
89,6 |
87,9 |
92,4 |
90 |
-1,24 |
|
32. |
Sales, rub |
5842032 |
5618480 |
4818016 |
5155808 |
5358584 |
5567632 |
5590704 |
5117392 |
5425243 |
-66659 |
|
33. |
Price of 1 kg of meat, rub |
112,00 |
112,00 |
112,00 |
112,00 |
112,00 |
112,00 |
112,00 |
112,00 |
112,00 |
0 |
|
34. |
Income from the house, rub |
1263121 |
1223563 |
829591 |
1154554 |
1117707 |
1111240 |
1201674 |
895513 |
1069476 |
48231 |
|
35. |
Income from 1 kg of meat, rub |
24,22 |
24,39 |
19,28 |
25,08 |
23,24 |
22,35 |
24,07 |
19,60 |
22,01 |
1,23 |
|
36. |
Type of feed premixes |
prov + veins |
prov + veins |
prov + veins |
prov + veins |
- |
prov + veins |
prov + veins |
prov + veins |
- |
- |
|
37. |
Slaughter scored, heads |
34543 |
34197 |
31692 |
34902 |
33834 |
33166 |
34150 |
31938 |
33085 |
749 |
|
38. |
Live weight, kg |
70375 |
67700 |
57545 |
61560 |
64295 |
65947 |
68261 |
60979 |
65062 |
-767 |
|
39. |
Carcass weight, kg |
50640 |
48699 |
41396 |
44288 |
46256 |
47435 |
49121 |
44032 |
46863 |
-607 |
|
40. |
1 head weight for slaughter, kg |
2,037 |
1,980 |
1,816 |
1,764 |
1,899 |
1,988 |
1,999 |
1,909 |
1,965 |
-0,066 |
|
41. |
Term cultivation, days |
44,5 |
43,5 |
43 |
41,5 |
43,1 |
44,5 |
43,5 |
43,5 |
43,8 |
-0,7 |
|
42. |
Average daily gain, g |
45,8 |
45,5 |
42,2 |
42,5 |
44,0 |
44,7 |
46,0 |
43,9 |
44,9 |
-0,9 |
|
43. |
% Meat yield |
72,0 |
71,9 |
71,9 |
71,9 |
71,9 |
71,9 |
72,0 |
72,2 |
72,0 |
-0,1 |
|
44. |
Sanitary defective heads, heads |
2730 |
2721 |
3232 |
3120 |
2951 |
3339 |
1425 |
3074 |
2613 |
338 |
|
45. |
Sanitary defective liveweight, kg |
2660 |
2570 |
2843 |
3055 |
2782 |
3987 |
1387 |
3009 |
2794 |
-12 |
|
46. |
Sanitary defective carcass weight, kg |
1521 |
1466 |
1822 |
1746 |
1639 |
2276 |
796 |
1659 |
1577 |
62 |
|
47. |
Санитарный бракованный от общего поголовья |
7,0 |
7,2 |
8,8 |
8,1 |
7,8 |
9,0 |
3,9 |
8,2 |
7,0 |
0,8 |
|
48. |
Sales heads |
1600 |
1085 |
1736 |
675 |
1274 |
540 |
1302 |
2527 |
1456 |
-182 |
|
49. |
Weight, kg |
1699 |
759 |
2201 |
440 |
1275 |
744 |
770 |
3225 |
1580 |
-305 |
|
50. |
Meat production plan |
65000 |
65000 |
65000 |
65000 |
65000 |
65000 |
65000 |
65000 |
65000 |
0 |
|
51. |
fact |
74734 |
71029 |
62589 |
65055 |
68352 |
70678 |
70418 |
67213 |
69436 |
-1084 |
|
52. |
(+ / -) Plan |
9734 |
6029 |
-2411 |
55 |
3352 |
5678 |
5418 |
2213 |
4436 |
- |
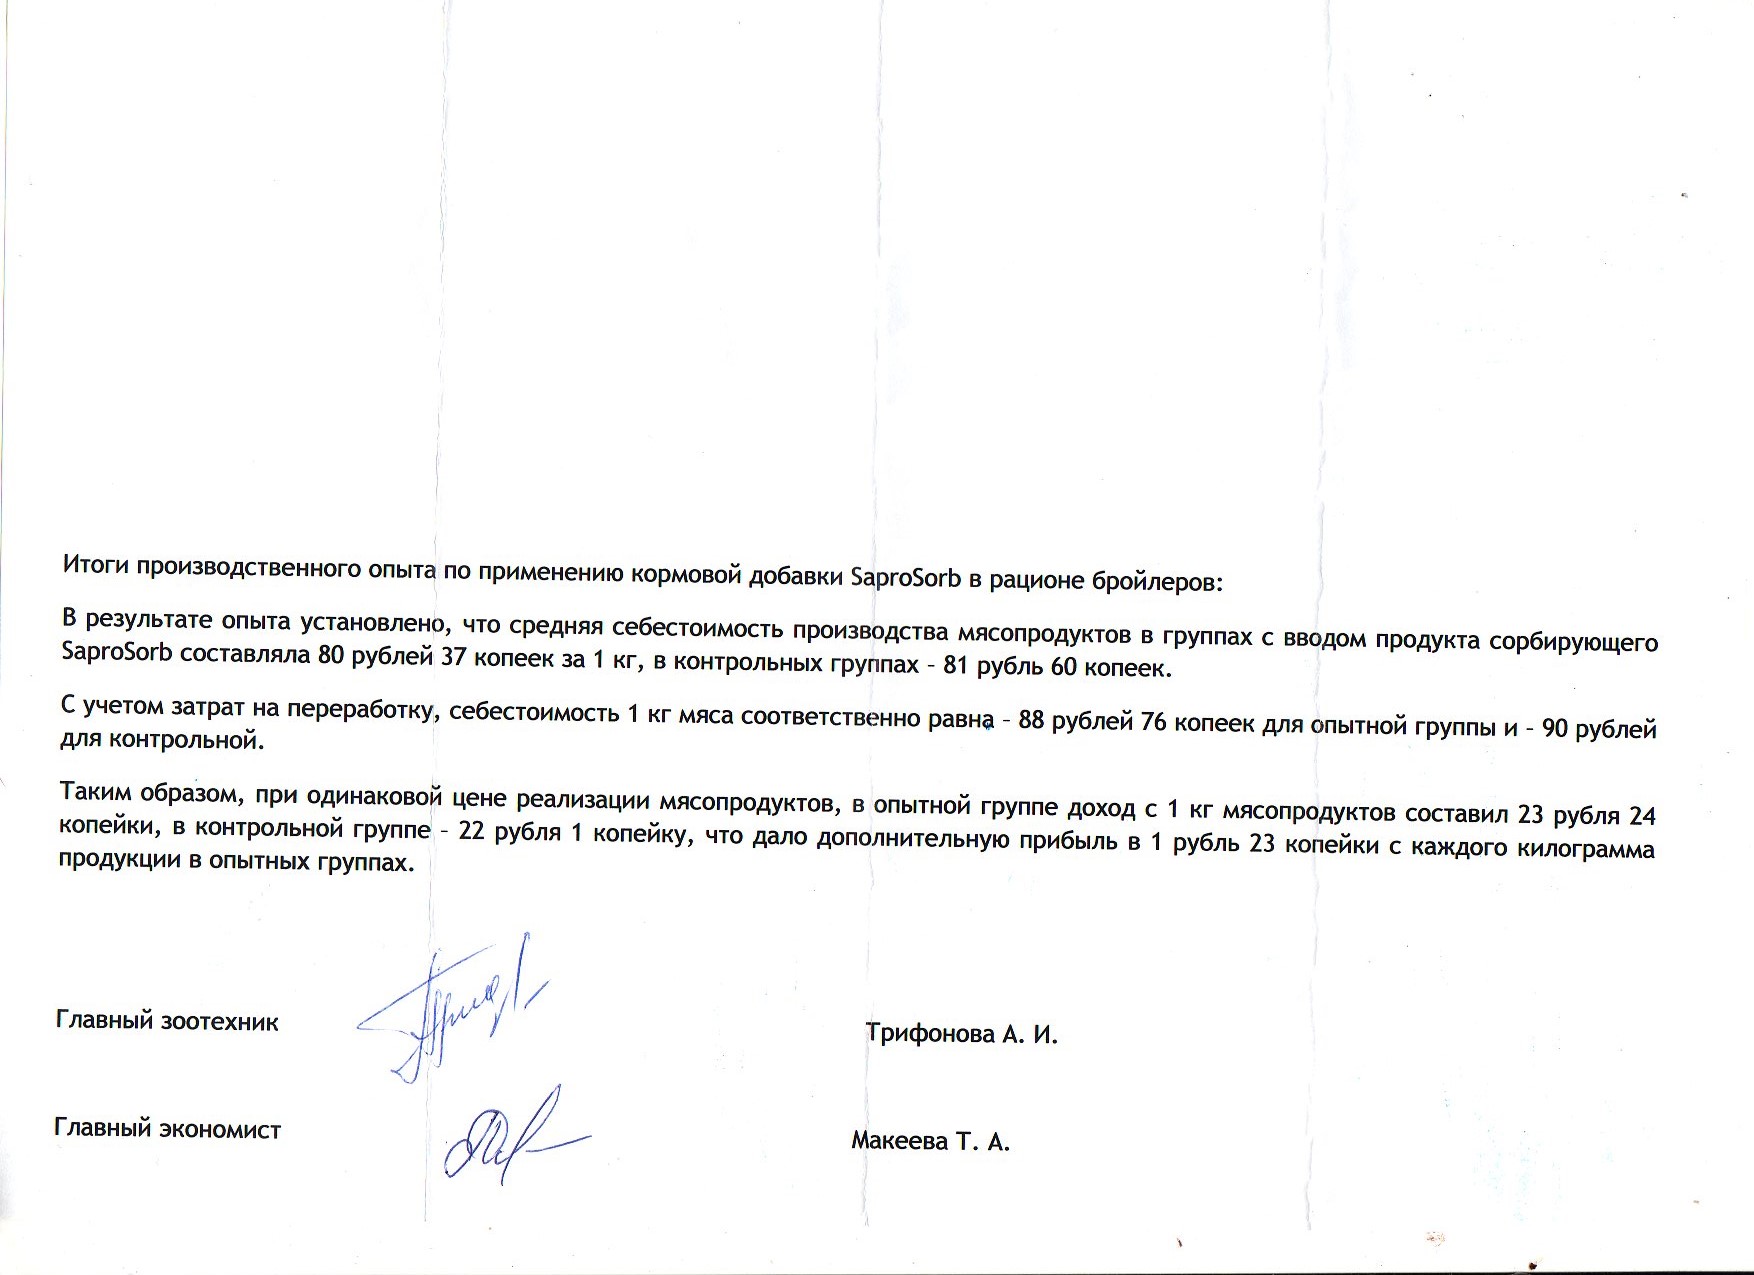
Results of production experience in the use of the feed additive in the diet of broilers SaproSorb:
As a result of the experience found that the average cost of production of meat products in the groups with the introduction of the product absorbing SaproSorb was 80 rubles 37 kopecks per 1 kg in the control group - 81 rubles 60 kopecks.
Taking into account the costs of processing, the cost of 1 kg of meat, respectively, equal to - 88 rubles 76 kopecks for the experimental group and - 90 rubles for the control.
Thus, at the same selling price of meat products in the experimental group income from 1 kg of meat was 23 rubles 24 kopecks in the control group - 22 rubles 1 penny that gave an additional profit of 1 ruble 23 kopecks for each kilogram of products in the experimental groups.
